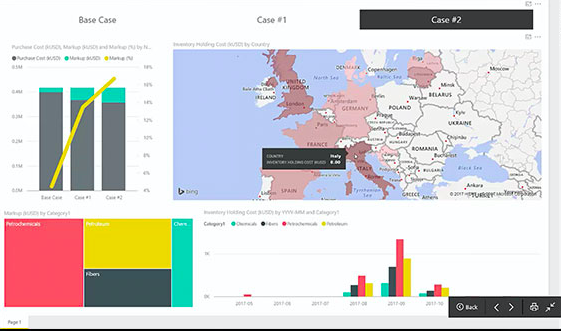
Compare Cases
Fast comparison of cases, visual representations that facilitate quick and easy understanding of key differences can easily play an even more important role than the analysis of individual cases. MultiplanR helps you in both.
Data from P&O and other, auxiliary systems is handled and stored in a scalable, distributed, fault-tolerant repository, enabling all past and future cases to be searchable and accessible for analysis and comparison at any time. Insights gained and solutions applied in past cases can be retrieved and compared to cases and options of today.
In the blink of an eye.
FEATURES:
|
TIPS:
|
Data Visualization
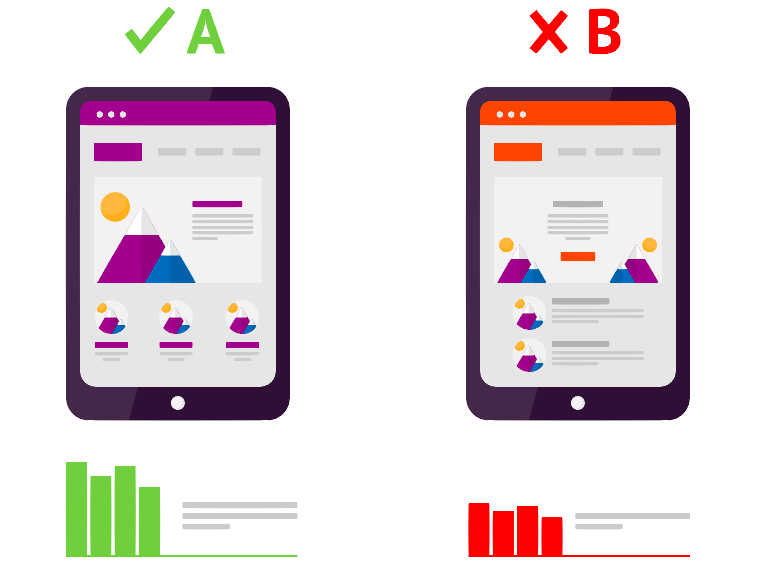
Data-driven companies of today emphasize the way information and insights are presented as access to an abundance of data is becoming more and more ubiquitous.
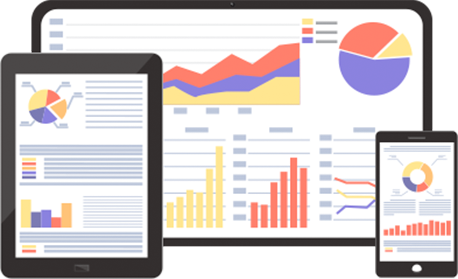
Your P&O system gains new life, as its fixed reports are extended with real, interactive dashboards and reports with drilling and ad-hoc analysis capabilities, answering your questions and showing you the insights and information that really do matter.
FEATURES:
|
Collaboration
Access and share data, work collaboratively with others.

- Collaborate on Master Data, see what others edit in real time
- Access and share insights with others from the central case and scenario repository: enhance information flow and access to team knowledge.
TIPS:
|

UNIFIED MASTER DATA
WITH GOVERNANCE
A collaboratively maintained Master Data repository with real-time, simultaneous editing and capabilities tailored specifically to these tasks, solves the typical problems of when the same words and identifiers mean different things in different systems and groups - and when different identifiers and vocabulary used in different paces should mean the same thing across systems.

INDUSTRY SPECIFIC
SOLUTION
Besides being easily adoptable to any industry, we strive to apply concepts, processes, techniques and best practices peculiar to a given industry in an industry specific data model. Years of industry knowledge is synthethized in a unified system.
Tailored to Your Needs
We understand that differentiation is a key business value.
We customize the system to further distinguish yourself and your brands on the markets of today and the future.
We enrich the industry specific MultiplanR data model, so that
you can utilize the latest planning and analysis methodologies of the industry.
Besides industry standard measures, KPIs and calculations specific to the company and internal processes are easily integrated.
TIPS:
|
SIGN UP FOR A FREE DEMO
Sign up now for our two-week pilot project and be one of the first 5 applicants to receive 100 hours of (partially on-site) consultative development for free, where our experts create a proof-of-concept, demonstrating how to get even more out of your existing systems.